Noisy conditional sample paths
This example generates conditional sample paths in a regression setting with heteroscedastic observation noise. It extends the previous sample-path example by distinguishing noisy measurements from the latent process.
What this example does
The script defines input-dependent observation noise, computes the latent posterior distribution, and draws conditional paths compatible with noisy observations. The covariance includes the observation-noise term where needed, while predictions and paths target the latent process.
Mathematical object
The noisy observation random variables are
with \(\tau_i^2\) depending on the observation location. The array zi
stores realized noisy values \(z_i^{\mathrm{obs}}\). The conditional
distribution of the latent process at prediction points is computed with the
observation covariance
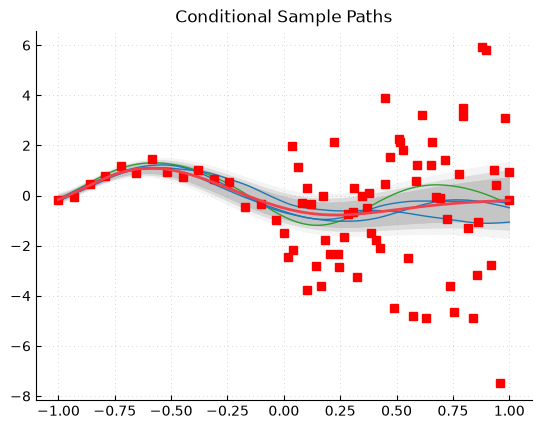
The conditional paths target \(Z_t=Z(x_t)\), not \(Z_t^{\mathrm{obs}}\). They therefore need not pass through the noisy realized observations.
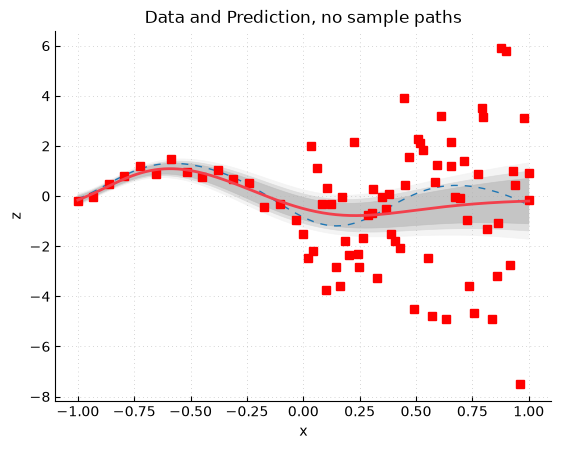
Outputs
The first output is the latent posterior distribution. The following outputs are conditional paths and posterior simulations. Because the observations are noisy, conditional paths are not required to pass exactly through observation values. Instead, they remain statistically compatible with the noise model.
API points
Heteroscedastic noise is represented through the covariance construction.
Conditional simulation remains a GP conditioning problem once the covariance has encoded the correct observation-noise structure.
Compare with Conditional sample paths to see the practical difference between noise-free and noisy conditioning.
Script: examples/gpmp_example11_sample_paths_noisy_obs.py
1"""
2GP Conditional Sample Paths
3
4This script demonstrates Gaussian Process (GP) regression with conditional sample paths
5on heteroscedastic noisy data. It generates synthetic data using a predefined test function (two bumps)
6and adds heteroscedastic Gaussian noise to the observed points. The script then constructs a GP
7model using a Matern kernel and a constant mean function. It generates sample paths from the GP
8prior, and then generates conditional sample paths given the observed data.
9
10Copyright (c) 2022-2023, CentraleSupelec
11Author: Emmanuel Vazquez <emmanuel.vazquez@centralesupelec.fr>
12License: GPLv3 (see LICENSE)
13"""
14
15import math
16import numpy as np
17import gpmp.num as gnp
18import gpmp as gp
19import gpmp.plot as gpplot
20
21
22def generate_data():
23 dim = 1
24 box = [[-1], [1]]
25
26 nt = 200
27 # build a regular grid and evaluate the test function
28 xt_ = gp.misc.designs.regulargrid(dim, nt, box)
29 zt = gp.misc.testfunctions.twobumps(xt_)
30
31 # extend xt so that the second column is the noise variance
32 xt = np.hstack((xt_, np.zeros((nt, 1))))
33
34 # observations
35 noise_std_func = lambda x : 0.1 + (x + 1)**2
36
37 xi1 = gp.misc.designs.regulargrid(dim, 30, box)
38 xi2 = gp.misc.designs.regulargrid(dim, 50, [[0], [1]])
39 xi_union = np.vstack((xi1, xi2))
40 ni = xi_union.shape[0]
41
42 # Calculate the noise standard deviation for each observation point
43 noise_std = noise_std_func(xi_union)
44
45 # Add the noise variance (noise_std**2) as the last column of xi
46 xi = np.hstack((xi_union, noise_std**2))
47
48 # Evaluation results with heteroscedastic Gaussian noise
49 u = np.random.normal(size=(xi.shape[0], 1))
50 zi = gp.misc.testfunctions.twobumps(xi_union).reshape((-1, 1)) + noise_std * u
51
52 return xt, zt, xi, zi
53
54
55def kernel_ii_or_tt(x, param, pairwise=False):
56 """Covariance of the observations at points given by x
57 Parameters
58 ----------
59 x : ndarray(n, d + 1)
60 Data points in dimension d. The last column is the noise
61 variance at the location.
62 param : ndarray(1 + d)
63 sigma2 and range parameters
64
65 """
66 p = 2
67 sigma2 = gnp.exp(param[0])
68 loginvrho = param[1]
69 noise_variance = x[:, -1] # Extract noise variance from the last column of x
70 noise_variance = gnp.asarray(noise_variance)
71
72 if pairwise:
73 # return a vector of covariances
74 K = sigma2 * gnp.ones((x.shape[0], )) + x[:, -1]
75 else:
76 # return a covariance matrix between observations
77 K = gnp.scaled_distance(loginvrho, x[:, :-1], x[:, :-1])
78 K = sigma2 * gp.kernel.maternp_kernel(p, K) + gnp.diag(noise_variance)
79
80 return K
81
82
83def kernel_it(x, y, param, pairwise=False):
84 """Covariance between observations and prediction points
85 """
86 p = 2
87 sigma2 = gnp.exp(param[0])
88 loginvrho = param[1]
89
90 if pairwise:
91 # return a vector of covariances
92 K = gnp.scaled_distance_elementwise(loginvrho, x[:, :-1], y[:, :-1])
93 else:
94 # return a covariance matrix
95 K = gnp.scaled_distance(loginvrho, x[:, :-1], y[:, :-1])
96
97 K = sigma2 * gp.kernel.maternp_kernel(p, K)
98 return K
99
100
101def kernel(x, y, param, pairwise=False):
102 if y is x or y is None:
103 return kernel_ii_or_tt(x, param, pairwise)
104 else:
105 return kernel_it(x, y, param, pairwise)
106
107
108def constant_mean(x, param):
109 return gnp.ones((x.shape[0], 1))
110
111
112def visualize(xt, zt, xi, zi, zpm, zpv, zsim, zpsim):
113 fig = gpplot.Figure(isinteractive=True)
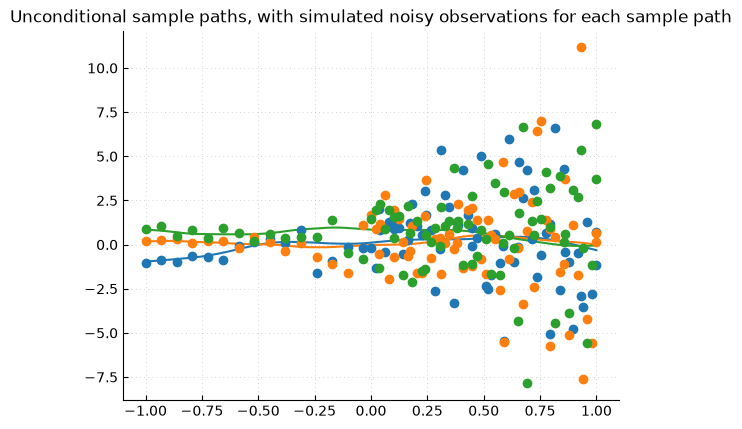
114 fig.plot(xt[:, 0], zt, 'C0', linestyle=(0, (5, 5)), linewidth=1)
115 fig.plot(xi[:, 0], zi, 'rs')
116 fig.plotgp(xt[:, 0], zpm, zpv)
117 fig.xylabels('x', 'z')
118 fig.title('Data and Prediction, no sample paths')
119 fig.show(grid=True)
120
121 ni = xi.shape[0]
122 nt = xt.shape[0]
123 xixt = np.vstack((xi, xt))
124 xi_ind = np.arange(ni)
125 xt_ind = np.arange(nt) + ni
126
127 fig = gpplot.Figure(isinteractive=True)
128 fig.plot(xixt[xt_ind, 0], zsim[xt_ind])
129 fig.ax.set_prop_cycle(None)
130 fig.plot(xixt[xi_ind, 0], zsim[xi_ind], 'o')
131 fig.title('Unconditional sample paths, with simulated noisy observations for each sample path')
132 fig.show(grid=True)
133
134 fig = gpplot.Figure(isinteractive=True)
135 fig.plot(xixt[xt_ind, 0], zt, 'C2', linewidth=1)
136 fig.plot(xixt[xt_ind, 0], zpsim, 'C0', linewidth=1)
137 fig.plot(xi[:, 0], zi, 'rs')
138 fig.plotgp(xt[:, 0], zpm, zpv)
139 fig.title('Conditional Sample Paths')
140 fig.show(grid=True)
141
142
143def main():
144 xt, zt, xi, zi = generate_data()
145
146 mean = constant_mean
147 meanparam = None
148 covparam = gnp.array([math.log(0.5**2), math.log(1 / .7)])
149 model = gp.core.Model(mean, kernel, meanparam, covparam)
150
151 zpm, zpv, lambda_t = model.predict(xi, zi, xt, return_lambdas=True)
152
153 ni = xi.shape[0]
154 nt = xt.shape[0]
155 xixt = np.vstack((xi, xt))
156 xi_ind = np.arange(ni)
157 xt_ind = np.arange(nt) + ni
158
159 n_samplepaths = 3
160 zsim = model.sample_paths(xixt, n_samplepaths, method='svd')
161 zpsim = model.conditional_sample_paths(zsim, xi_ind, zi, xt_ind, lambda_t)
162
163 visualize(xt, zt, xi, zi, zpm, zpv, zsim, zpsim)
164
165
166if __name__ == "__main__":
167 main()