Dataloader-based parameter selection
This example shows how observations can be passed through Dataset and
DataLoader objects during parameter selection. Use this form when the
selection criterion should be evaluated on batches instead of a single full
array at every call.
What this example does
The script creates a test problem, stores observations in a Dataset, wraps
it with a DataLoader, and calls select_parameters_with_remap with the
dataloader argument. The selected model is then used for prediction and the
preview plots predicted values against reference values.
Mathematical object
The model and REMAP criterion are the same as in the array-based examples. The dataloader changes how the criterion is evaluated. If batches \(b_1,\ldots,b_q\) have sizes \(n_1,\ldots,n_q\), the batch wrapper evaluates a weighted scalar objective of the form
where \(J_\ell(\theta)\) is the selection criterion evaluated on batch
\(b_\ell\). With batches_per_eval=0, one criterion call uses the full
loader. With a positive batches_per_eval, one criterion call uses only that
many successive batches, cycling through the loader.
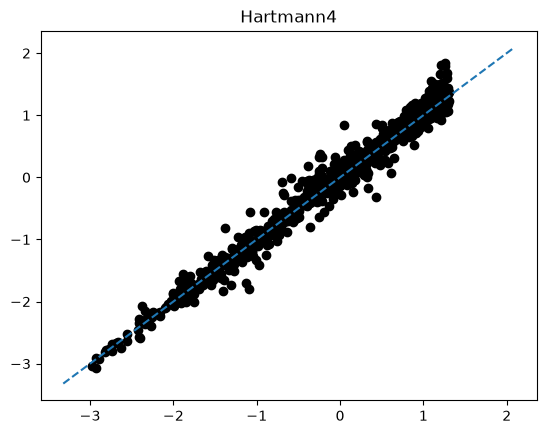
Outputs
The displayed quantities are GP predictions and reference values at test points. Points near the diagonal indicate accurate predictions. Systematic deviations from the diagonal suggest bias, poor covariance parameters, or insufficient observations.
API points
Selection helpers accept either explicit
xi, ziarrays or adataloader. Do not pass both.DataLoadercontrols batching. The selection criterion still returns a scalar objective for optimization.The selected
model.covparamis used normally bymodel.predictafter batched selection.
Script: examples/gpmp_example30_dataloader.py
  1"""
  2Prediction of some classical test functions in dimension > 2
  3
  4An anisotropic Matern covariance function is used for the Gaussian
  5Process (GP) prior. The parameters of this covariance function
  6(variance and ranges) are estimated using the Restricted Maximum
  7A Posteriori (ReMAP).
  8
  9This script uses a DataLoader object to structure the input dataset
 10into fixed-size batches for parameter estimation.
 11
 12----
 13Author: Emmanuel Vazquez <emmanuel.vazquez@centralesupelec.fr>
 14Copyright (c) 2022-2026, CentraleSupelec
 15License: GPLv3 (see LICENSE)
 16"""
 17import gpmp.num as gnp
 18import gpmp as gp
 19from gpmp.dataloader import Dataset, DataLoader
 20import matplotlib.pyplot as plt
 21
 22
 23def choose_test_case(problem, ni=2000):
 24    if problem == 1:
 25        problem_name = "Hartmann4"
 26        f = gp.misc.testfunctions.hartmann4
 27        dim = 4
 28        box = [[0.0] * 4, [1.0] * 4]
 29        xi = gp.misc.designs.ldrandunif(dim, ni, box)
 30        nt = 1000
 31        xt = gp.misc.designs.ldrandunif(dim, nt, box)
 32
 33    elif problem == 2:
 34        problem_name = "Hartmann6"
 35        f = gp.misc.testfunctions.hartmann6
 36        dim = 6
 37        box = [[0.0] * 6, [1.0] * 6]
 38        xi = gp.misc.designs.ldrandunif(dim, ni, box)
 39        nt = 1000
 40        xt = gp.misc.designs.ldrandunif(dim, nt, box)
 41
 42    elif problem == 3:
 43        problem_name = "Borehole"
 44        f = gp.misc.testfunctions.borehole
 45        dim = 8
 46        box = [
 47            [0.05, 100.0, 63070.0, 990.0, 63.1, 700.0, 1120.0, 9855.0],
 48            [0.15, 50000.0, 115600.0, 1110.0, 116.0, 820.0, 1680.0, 12045.0],
 49        ]
 50        xi = gp.misc.designs.maximinldlhs(dim, ni, box)
 51        nt = 1000
 52        xt = gp.misc.designs.ldrandunif(dim, nt, box)
 53
 54    elif problem == 4:
 55        problem_name = "detpep8d"
 56        f = gp.misc.testfunctions.detpep8d
 57        dim = 8
 58        box = [[0.0] * 8, [1.0] * 8]
 59        xi = gp.misc.designs.maximinldlhs(dim, ni, box)
 60        nt = 1000
 61        xt = gp.misc.designs.ldrandunif(dim, nt, box)
 62
 63    return problem_name, f, dim, box, ni, xi, nt, xt
 64
 65
 66def constant_mean(x, param):
 67    return gnp.ones((x.shape[0], 1))
 68
 69
 70def kernel(x, y, covparam, pairwise=False):
 71    p = 10
 72    return gp.kernel.maternp_covariance(x, y, p, covparam, pairwise)
 73
 74
 75def visualize_predictions(problem_name, zt, zpm):
 76    plt.figure()
 77    plt.plot(zt, zpm, "ko")
 78    (xmin, xmax), (ymin, ymax) = plt.xlim(), plt.ylim()
 79    xmin = min(xmin, ymin)
 80    xmax = max(xmax, ymax)
 81    plt.plot([xmin, xmax], [xmin, xmax], "--")
 82    plt.title(problem_name)
 83    plt.show()
 84
 85
 86def main():
 87    problem = 2
 88    problem_name, f, dim, box, ni, xi, nt, xt = choose_test_case(problem, ni=1000)
 89
 90    zi = f(xi)
 91    zt = f(xt)
 92    dataset = Dataset(xi, zi)
 93    loader = DataLoader(dataset, batch_size=200, shuffle=False)
 94
 95    model = gp.core.Model(constant_mean, kernel)
 96
 97    model, info = gp.kernel.select_parameters_with_remap(
 98        model, dataloader=loader, info=True
 99    )
100
101    gp.modeldiagnosis.diag(model, info, xi, zi)
102
103    gp.modeldiagnosis.plot_selection_criterion_crosssections(
104        info=info,
105        selection_criterion=info.selection_criterion_nograd,
106        covparam=None,
107        n_points=100,
108        param_names=None,
109        criterion_name="selection criterion",
110        criterion_name_full="Cross sections for negative log restricted likelihood",
111        ind=[0, 1, 2],
112        ind_pooled=None,
113        param_box=None,
114        param_box_pooled=None,
115        delta=5.0,
116    )
117
118    (zpm, zpv) = model.predict(xi, zi, xt)
119
120    visualize_predictions(problem_name, zt, zpm)
121
122    zloom, zloov, eloo = model.loo(xi, zi)
123    gp.plot.plot_loo(zi, zloom, zloov)
124
125    gp.modeldiagnosis.perf(
126        model,
127        xi,
128        zi,
129        loo=True,
130        loo_res=(zloom, zloov, eloo),
131        xtzt=(xt, zt),
132        zpmzpv=(zpm, zpv),
133    )
134
135
136if __name__ == "__main__":
137    main()