Noisy observations
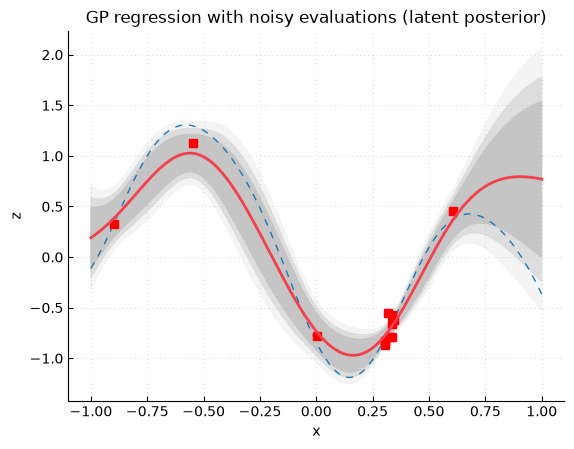
This example models noisy observations and predicts the latent, noise-free process. It shows how a covariance function can distinguish observation inputs from latent prediction targets and add a noise term only where appropriate.
What this example does
The script generates latent function values and noisy observations. The model uses an input flag to identify observation points, so the covariance can add the observation-noise variance on the diagonal for observations while leaving latent prediction points noise-free.
Mathematical object
The latent process is still \(Z \sim \mathcal{GP}(m, k_\theta)\), but the observed random variable is noisy:
The covariance used for the observations is therefore
Prediction targets use the latent random variable \(Z_t=Z(x_t)\), so the cross-covariance between observations and targets is \(k_\theta(x_i,x_t)\), without an observation-noise term.
In the script, zi stores realizations of
\(Z_i^{\mathrm{obs}}\).
Outputs
Observation values are noisy and therefore need not lie exactly on the posterior mean. The posterior distribution represents the latent process, not the noisy data-generating variable. Compared with the noise-free examples, uncertainty remains nonzero at observation locations because the observations are imperfect measurements.
API points
Noisy-observation models are usually implemented by writing a covariance function that adds a nugget or input-dependent noise term.
model.predictstill returns posterior mean and variance for the target inputs supplied by the user.The distinction between noisy observations and latent targets is a modeling convention encoded in the covariance function, not a separate GPmp model class.
Script: examples/gpmp_example06_1d_regression.py
  1'''
  2Gaussian process regression in 1D with noisy evaluations.
  3
  4We want the posterior of the latent process (noise-free function) from noisy
  5observations. To distinguish both, we add an extra column to each input row:
  6[coords..., flag], with flag=0 for latent targets and flag=1 for noisy
  7observations.
  8
  9The kernel uses only the coordinates for distances. For k(x, x), the latent
 10covariance is computed and noise variance is added on the diagonal where
 11flag=1. This means only noisy observations get a noise term. Cross-covariances
 12k(x, y) with x not equal to y ignore flags and are purely latent. With
 13pairwise=True, the returned vector is the diagonal of this same covariance
 14matrix.
 15
 16Thus:
 17- xi (flag=1) are noisy observations, so k(xi, xi) has diagonal noise.
 18- xt (flag=0) are latent targets, so k(xt, xt) is noise-free.
 19- The cross block k(xi, xt) is noise-free.
 20
 21This yields the posterior distribution of the latent process. To predict noisy
 22outputs at targets instead, pass xt with flag=1.
 23
 24----
 25Author: Emmanuel Vazquez <emmanuel.vazquez@centralesupelec.fr>
 26Copyright (c) 2022-2026, CentraleSupelec
 27License: GPLv3 (see LICENSE)
 28'''
 29import math
 30import numpy as np
 31import gpmp.num as gnp
 32import gpmp as gp
 33
 34
 35def generate_data(noise_std):
 36    """Create a 1D dataset with noisy observed values."""
 37    dim = 1
 38    nt = 200
 39    box = [[-1], [1]]
 40    xt = gp.misc.designs.regulargrid(dim, nt, box)
 41    zt = gp.misc.testfunctions.twobumps(xt)
 42
 43    ind = [10, 45, 100, 130, 130, 130, 131, 132, 133, 133, 133, 134, 160]
 44    xi = xt[ind]
 45    zi = zt[ind] + noise_std * np.random.randn(len(ind))
 46    return xt, zt, xi, zi
 47
 48
 49def _add_noise_information(x, flag):
 50    """Append one flag column: 0 latent, 1 noisy."""
 51    if x.ndim == 1:
 52        x = x.reshape(-1, 1)
 53    n = x.shape[0]
 54    f = np.full((n, 1), int(flag)) if np.isscalar(flag) else np.asarray(flag).reshape(n, 1)
 55    return np.hstack((x, f))
 56
 57
 58def _split(x):
 59    """Split flagged x into (coords, flag)."""
 60    return x[:, :-1], x[:, -1].reshape(-1)
 61
 62
 63def constant_mean(x, _):
 64    """Constant mean."""
 65    return gnp.ones((x.shape[0], 1))
 66
 67
 68def kernel_ii_or_tt(x, param, pairwise=False):
 69    """Latent Matern on (x,x); add diag(noise*flag) only here."""
 70    p = 2
 71    sigma2 = math.exp(param[0])
 72    noise_var = math.exp(param[1])
 73    loginvrho = param[2:]
 74
 75    x_coord, flag = _split(x)
 76
 77    if pairwise:
 78        # Prior variance; add observation noise where flag == 1.
 79        return sigma2 * gnp.ones((x_coord.shape[0],)) + noise_var * flag
 80
 81    D = gnp.scaled_distance(loginvrho, x_coord, x_coord)
 82    K = sigma2 * gp.kernel.maternp_kernel(p, D)
 83    K = K + gnp.diag(noise_var * flag)  # noise only on observed points
 84    return K
 85
 86
 87def kernel_it(x, y, param, pairwise=False):
 88    """Latent Matern cross-covariance (no noise on any block)."""
 89    p = 2
 90    sigma2 = math.exp(param[0])
 91    loginvrho = param[2:]
 92
 93    x_coord, _ = _split(x)
 94    y_coord, _ = _split(y)
 95
 96    if pairwise:
 97        D = gnp.scaled_distance_elementwise(loginvrho, x_coord, y_coord)
 98    else:
 99        D = gnp.scaled_distance(loginvrho, x_coord, y_coord)
100    return sigma2 * gp.kernel.maternp_kernel(p, D)
101
102
103def kernel(x, y, param, pairwise=False):
104    """Dispatch to (x,x) or (x,y)."""
105    return kernel_ii_or_tt(x, param, pairwise) if (y is x or y is None) else kernel_it(x, y, param, pairwise)
106
107
108def main():
109    """Fit the GP and predict the latent posterior on a grid."""
110    noise_std = 1e-1
111    xt, zt, xi, zi = generate_data(noise_std)
112
113    # Flag observed inputs as noisy (1), targets as latent (0)
114    xi_with_side_information = _add_noise_information(xi, 1)
115    xt_with_side_information = _add_noise_information(xt, 0)
116
117    mean = constant_mean
118    meanparam = None
119    covparam = np.array([
120        math.log(0.5 ** 2),        # log sigma^2 (signal variance)
121        2.0 * math.log(noise_std), # log noise variance
122        math.log(1 / 0.7),         # log 1/rho (length-scale inverse) for 1D
123    ])
124
125    model = gp.core.Model(mean, kernel, meanparam, covparam, meantype="linear_predictor")
126    zpm, zpv = model.predict(xi_with_side_information, zi, xt_with_side_information)
127    return xt, zt, xi, zi, zpm, zpv
128
129
130def visualize(xt, zt, xi, zi, zpm, zpv):
131    """Plot reference function, observations, and GP posterior (latent)."""
132    fig = gp.plot.Figure(isinteractive=True)
133    fig.plot(xt, zt, 'C0', linestyle=(0, (5, 5)), linewidth=1)
134    fig.plot(xi, zi, 'rs')
135    fig.plotgp(xt, zpm, zpv)
136    fig.xylabels('x', 'z')
137    fig.title('GP regression with noisy evaluations (latent posterior)')
138    fig.show(grid=True)
139
140
141if __name__ == "__main__":
142    xt, zt, xi, zi, zpm, zpv = main()
143    visualize(xt, zt, xi, zi, zpm, zpv)