Example 30: excursion set on a fixed grid
Script: examples/example30_excursionset_gridset.py
Purpose
The script estimates a one-dimensional excursion set on a fixed grid. The target set is
New evaluations are selected by an excursion-set criterion evaluated on the grid. Excursion probabilities and related criteria also appear in constrained Bayesian optimization [3].
What is computed
posterior mean and variance on the fixed grid.
excursion probabilities
P(Y(x) > u_target | observations).excursion misclassification quantities.
excursion_wMSEvalues used for selecting the next grid point.expected excursion volume and expected misclassification summaries through the strategy object.
Main objects
gpmpcontrib.optim.excursionset.ExcursionSetGridSearchgpmpcontrib.samplingcriteria.excursion_probabilitygpmpcontrib.samplingcriteria.excursion_misclassification_probabilitygpmpcontrib.samplingcriteria.excursion_wMSE
Outputs
Run python examples/example30_excursionset_gridset.py from the repository
root to execute the example. Regenerate the static figure with
cd docs && python make_example_results.py.
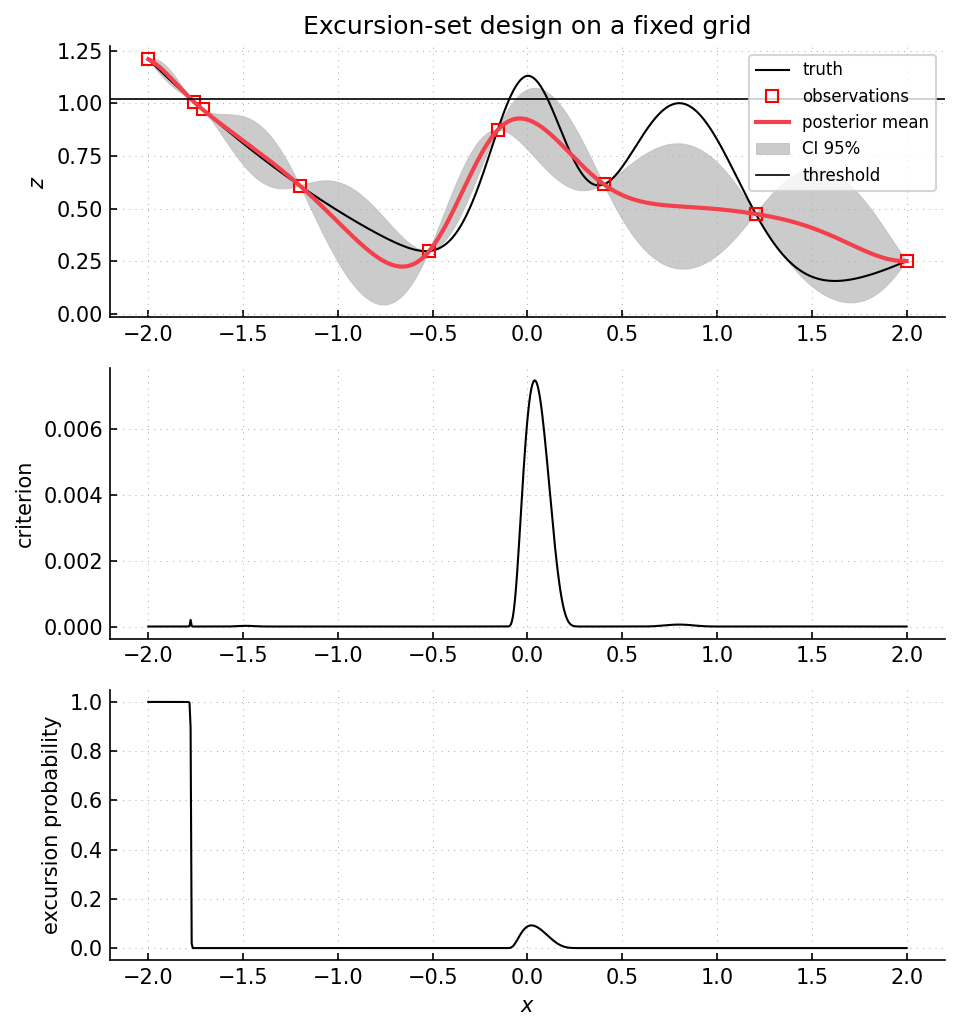
Top panel: target excursion threshold, observations, and GP posterior.
Middle panel: excursion_wMSE criterion on the grid. Its largest values
occur near uncertain threshold crossings, where additional observations can
change the estimated excursion set. Lower panel: posterior probability of
exceeding the target threshold.
Source excerpt
# -- initialize a model and the ei algorithm
model = gpc.Model_ConstantMean_Maternp_REMAP(
    "GP1d",
    output_dim=problem.output_dim,
    mean_specification={"type": "constant"},
    covariance_specification={"p": 2},
)

algo = es.ExcursionSetGridSearch(problem, model, xt, u_target)

algo.set_initial_design(xi)

# -- visualization


def plot(show=True, x=None, z=None):
    zpm, zpv = algo.predict(xt, convert_out=False)
    crit = sampcrit.excursion_wMSE(algo.u_target, zpm, zpv)
    pe = sampcrit.excursion_probability(algo.u_target, zpm, zpv)

    fig = gp.plot.Figure(nrows=3, ncols=1, isinteractive=True)
    fig.subplot(1)
    fig.plot(xt, zt, "k", linewidth=0.5)
    fig.plot(fig.xlim(), [u_target] * 2, "k", linewidth=0.5)
    if z is not None:
        fig.plot(x, z, "b", linewidth=0.5)
    fig.plotdata(algo.xi, algo.zi)
    fig.plotgp(xt, gnp.to_np(zpm), gnp.to_np(zpv), colorscheme="simple")
    fig.ylabel("$z$")
    fig.title(f"Posterior GP, ni={algo.xi.shape[0]}")
    fig.subplot(2)
    fig.plot(xt, crit, "k", linewidth=0.5)
    # if plot_xnew:
    #     fig.plot(np.repeat(eialgo.xi[-1], 2), fig.ylim(), color="tab:gray", linewidth=3)
    fig.ylabel("criterion")
    fig.subplot(3)
    fig.plot(xt, pe, "k", linewidth=0.5)
    fig.ylabel("Prob. excursion")
    fig.xlabel("x")
    if show:
        fig.show()

    return fig