Example 20: relaxed Gaussian process
Script: examples/example20_regp.py
Purpose
The script demonstrates relaxed Gaussian-process (reGP) remodeling for a threshold-oriented target. Selected observations are allowed to move inside a relaxation interval, and the relaxed values are optimized together with covariance parameters before prediction. See Petit et al. [6] for the method.
What is computed
an initial GP model and posterior predictions.
membership of observations in the relaxation interval.
relaxed observation values and updated covariance parameters.
posterior predictions from the relaxed model.
a selected relaxation threshold based on a tCRPS criterion.
a plot comparing observations, relaxed observations, and predictions.
Main objects
gpmpcontrib.regp.regp.predictgpmpcontrib.regp.regp.remodelgpmpcontrib.regp.regp.select_optimal_threshold_above_t0
Outputs
Run python examples/example20_regp.py from the repository root to execute
the example. Regenerate the static figure with
cd docs && python make_example_results.py.
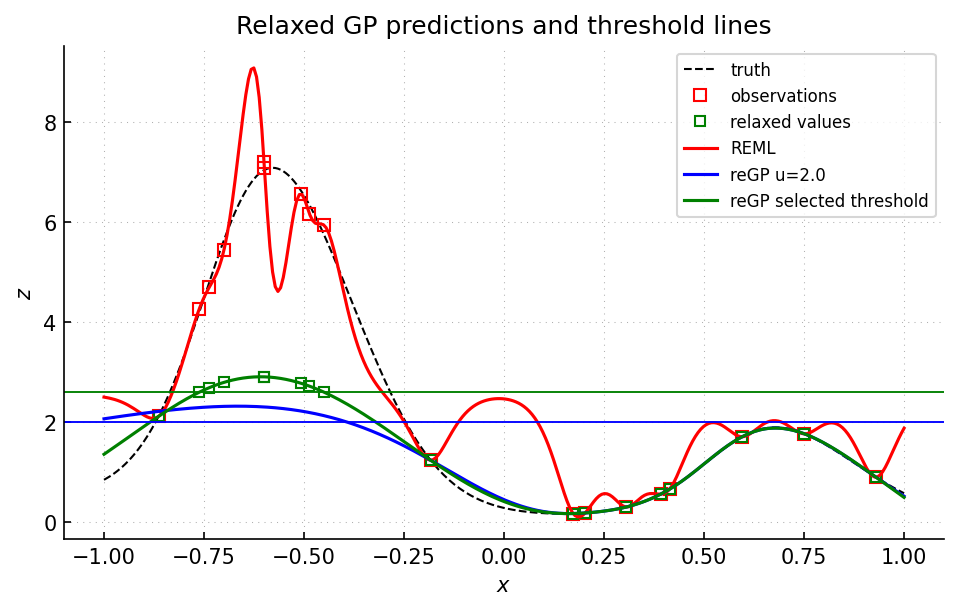
Black dashed curve: reference function. Red curve: initial REML posterior mean. Blue and green curves: reGP posterior means obtained after relaxing observations above the corresponding horizontal thresholds. Green points: relaxed observation values used by the selected-threshold reGP model.
Source excerpt
    Visualize the results using gp.plot (a matplotlib wrapper).

    Parameters
    ----------
    xt : numpy.ndarray
        Target x values
    zt : numpy.ndarray
        Target z values
    xi : numpy.ndarray
        Input x values
    zi : numpy.ndarray
        Input z values
    zpm : numpy.ndarray
        Posterior mean
    zpv : numpy.ndarray
        Posterior variance
    """
    if fig is None:
        fig = gp.plot.Figure(isinteractive=True)
    fig.plot(xt, zt, "k", linewidth=1, linestyle=(0, (5, 5)))
    fig.plotdata(xi, zi)
    fig.plotgp(xt, zpm, zpv, colorscheme="hue", rgb_hue=rgb_hue)
    fig.xlabel("$x$")
    fig.ylabel("$z$")